
![]()
On the 16th of December I bought shares in Exxon Mobil (XOM) – along with purchases of Chevron (see below) – at a price of USD 87.50. At this price, Exxon Mobil fulfilled all but two of the seven investment criteria that I follow to build up financial independence. Find a detailed analysis here (PDF file).
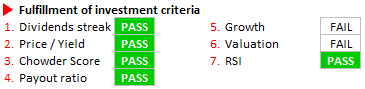
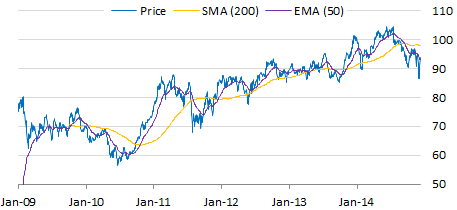
XOM currently trades at its long-term resistance at about USD 87. Before that, this level acted as barrier back from Jan 2011. The stock took a deep dive on the back of the plunging oil price, coming from USD 104 to USD 86, from where it bounced back the last days. Compared to other oil majors, XOM stock price depreciated less than its peers showing once again its superior resistancy.
Current dividend yield of 3.2% is very attractive, well above its 5-year average yield. My target yield is 3% which can currently be achieved at a price of USD 92. XOM’s board of directors is committed to pay a reliable and growing dividend, as it has done so the past 32 years. Payout ratio of 33% is very safe, leaving substantial headroom for dividend increase also in case earnings should fall. Chowder score at 13% results from 3% yield and 10% 5-year dividend CAGR. All my growth criteria (>5%) are fulfilled, despite last 5-year EPS growth which was only 3.1%.

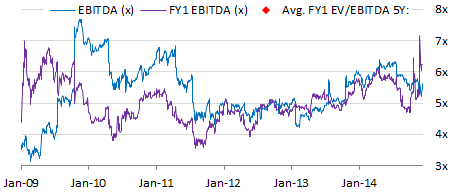
FY1 EBITDA valuation is volatile recently potentially resulting from changes in analyst estimates (FY1). I consider a FY1 EBITDA of 5.0x as fair value, which XOM did not pass, however, was pretty close. XOM’s current EV/EBITDA however, has coming down in line with the drop in stock price to 5.2x, which is approx. in line with ist 5-year valuation average. Given that, I can very well justify a buy.
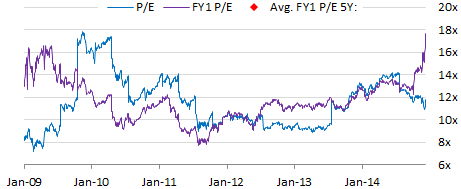
XOM currently trades on its 5-year average current P/E ratio at around 11.0x, indicating a fair valuation. However, I prefer to take into account the FY1 P/E ratio. The difference to current P/E is, that for the denominator “earnings” the consensus earnings expectations (FY1 EPS) of analysts are taking into consideration rather than the trailing (last twelve month) actual earnings. Therefore, the FY1 EBITDA multiple reflects the current price in relation to expectations about the future earnings potential. Recently, this measure abnormally spiked to nearly 18.0x. This is a clear warning sign, that current valuation levels are still too high. However, as all my other measures signal a passing of my investment criteria, I believe that current earnings expectations are downward biased and potentially normalize when the dust settles.
Along with Chevron, I am more than happy to have added this AAA-rated dividend champion at a 3.2% yield to my income portfolio. As I write this article, XOM shares increased by 7% vs. my entry price to c. USD 93.6.
For your convenience please find a printable version of Exxon’s stock analysis here.